COVID-19 and Lockdown Based on Proportion
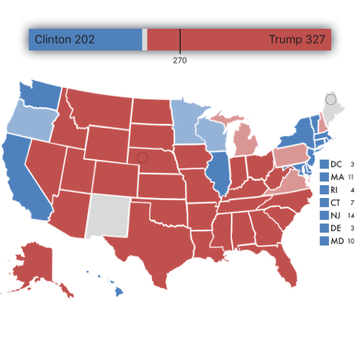
Currently, according to the New York Times, there are 18 of the 49 contiguous U.S. states plus the District of Columbia where COVID-19 cases are increasing.
There are 20 cases where numbers are roughly the same.
There are 11 states where cases are decreasing.
I have removed Alaska and Hawaii as they are not in the contiguous U.S. and therefore travel to either state is more difficult, decreasing the risk of spread. This idea is reinforced by the fact that both states show a fairly sharp decline in cases.
Looking at these numbers as percentages we get:
Increasing = 18/49 = 0.36437
Same = 20/49 = 0.408163
Decreasing = 11/49 = 0.22449
So roughly, increasing 36%, same, 41%, and decreasing 22% with 1% left off because of rounding.
Perhaps the most well-known proportion is the Golden Mean or 0.618 / 0.382 or 61.8% / 38.2%. People attribute all kinds of significance to the Golden Mean or Golden Measure. Some say it is a proportion that is pleasing to the eye. Others look at it as a way that orderly growth happens within nature.
I typically use 0.625 and 0.375 which is more of a Murray Math adaptation of the same concept to give 62.5% and 37.5%.
My intention is not to go into a lecture on Murray Math, so please feel free to look that up on your favorite search engine for more details.
Getting back to U.S. COVID-19 cases and states where the cases are growing, the same, or declining we, again, have these rough percentages:
Increasing: 36%
Same: 41%
Decreasing: 22%
Just as numbers and proportion, they don't paint a very hopeful picture of where we are in fighting COVID-19 in the United States.
Why? Good question.
We are one state increase away from this...
19/49 = 38.8% or 39% if we round up.
At 38.8% we have now tipped the 37.5% / 62.5% balance a little bit more in the direction of increasing cases.
That seems like a whole lot of concern about nothing, right?
Wrong.
If we look at these percentages through the lens of levels we have a more serious problem. Here are the levels...
1 - 30.72 - 32.768
2 - 32.768 - 34.816
3 - 34.816 - 36.864
4 - 36.864 - 38.912
5 - 38.912- 40.96
6 - 40.96 - 43.008
7 - 43.008 - 45.056
8 - 45.056 - 47.104
9 - 47.104 - 49.152
Keep in mind, COVID-19 spreads exponentially along a curve. By adding just one additional state you cross above the 3rd level and into the 5th. This puts you one state away from...
20/49 = 40.8% or 41%
Next is 21/49 = 42.8% or 43%
The sixth level tends to be where acceleration can occur. The U.S. would then run the risk of getting closer to 24 or 25 of the contiguous 49 (48 states plus D.C.) - just under or just over - or half of the landlocked states having increasing COVID-19 outbreaks again.
We're dangerously close, by opening states back up while many are still in a state of increasing spread, to risking that COVID-19 starts spreading to more states and tipping over from more states either steady or decreasing to more states increasing again.
These kinds of decisions are extremely difficult. The risks from COVID-19 are very grave for some portion of the population. The economic consequences to our economy and the ability of the healthcare system to serve all of our citizens in need are gravely threatened the longer things remain in lockdown.
There are no easy choices, and the risks are great no matter what path states choose. But at least being aware of the risks before heading down one path or another allows us to proceed with our eyes open.
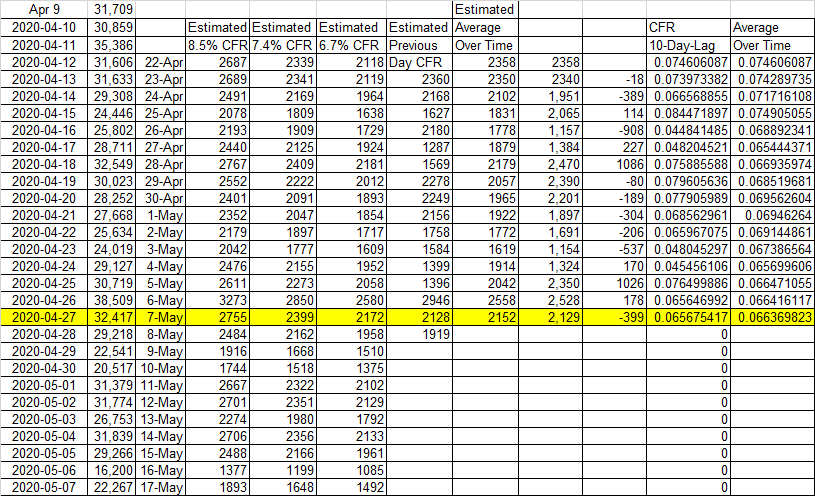
Current U.S. COVID-19 Deaths for 5-7-20 = 2,129.
The Case Fatality Rate (CFR) has been slowly settling down to just under 6.7%.
You may notice that if by using the previous day's CFR multiplied by new cases from 10 days ago, you will end up with a number, on average, that is very close to actual deaths over time.
From 23 April to 7 May actual COVID-19 U.S. Deaths were 29,031.
From 23 April to 7 May estimated using average CFR as it changed over time estimated 30,118.
For the same period using the previous day CFR we get an estimate of 29,086.
Using the 6.7% CFR for the same period gives an estimate of 29,401.
Over time, using the previous day's CFR, has given an estimate that - over time - has been very close to the actual total deaths.
While more complex models such as University of Washington's Institute for Health Metrics and Evaluation (IHME) have bounced around somewhat, my much simpler estimate(s) do a good job looking 10 days into the future.
On the other hand, if you want a model that ...
I recently published a larger post about estimated U.S. COVID-19 deaths.
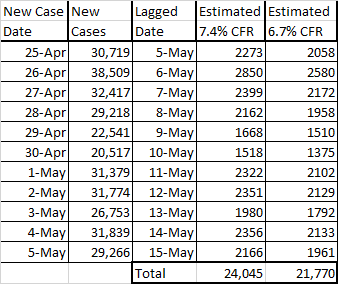
Below is a table showing estimated deaths from today - 5-5-20 to 5-15-20.
Today's deaths total was 2,350 according to Worldometers.
https://www.worldometers.info/coronavirus/#countries
That total was above the 7.4% Case Fatality Rate of 2,273 but under the (not shown) 8.5% level of 2,611.
Given that U.S. new cases is still above 20K per day, and that the CFR is dropping slowly, it appears probable that U.S. COVID-19 deaths will reach 100K by the 3rd or 4th week of May.
Note that tomorrow (May 6th) COVID-19 Deaths in the U.S. could be pretty high given they are based on 38,509 cases from April 26th. Nothing would make me happier to be wrong about this and the numbers come in much lower, but I'm afraid that will not be the case.
The Dow Jones Industrial Average has been declining the past few days and is now near 23,808.
Using my method of projecting price, 23,808 was projected to be the next target.
After that, the next targets were either 24,576 or 22,272.
24,576 was reached.
After 24,576 we would see either 25,344 or 23,040 next.
Although it's not impossible to reach 25,344 next, the probability given that as this is being posted the DJIA is trading at 23,843.53, 25,344 does not appear to be a very probable level to reach next. More probable is moving back through 23,808 and then 23,040.
26,624 represents probable stronger resistance to the upside.
Looking at the market from a long-term view - the DJIA is trading in a range that spans from 12,288 to 30,720.
The market has backed down several times after approaching the 29,000 level.
If we examine the DJIA in terms of the long-term represented as ranges we get:
1 - 12,288 - 14,336
2 - 14,336 - 16,384
3 - 16,384 - 18,432
4 - 18,432 - 20,480
5 - 20,480 - 22,528
6 - 22,528 - ...